Saturday, April 28, 2012

Thursday, April 12, 2012
Healthy Teen Living Presentation
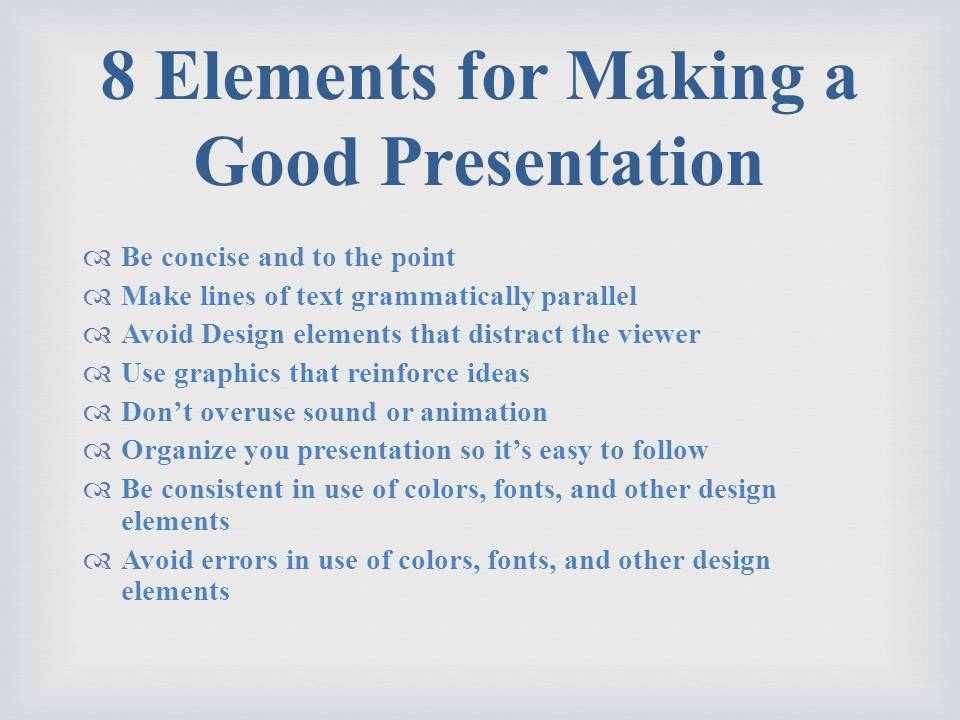
In lesson 4-Manage Presentations I learned about creating a good PowerPoint presentation. I learned how to make an outline and then put it into a powerpoint. I also learned some skills for a good presentation. I earned that I have to be aware of my audience and who I'm presenting to. I learned how to use different animations and effects in my presentations. I learned that I have o keep my transitions and animations consistent.
Tuesday, April 10, 2012

Friday, March 30, 2012
Copyright Presentation
In Lesson 3 I learned how to create a good presentation. I also learned how to organize a presentation and how to use good effects in a presentation. I learned how to put an outline into a PowerPoint presentation. In this lesson, I saw how using slide master is much more easier than editing every single slide. I learned that you can make transitions to slides, and add animations to words. I can also point out the different parts of a PowerPoint.
Monday, March 12, 2012
How Can Presentation Skills Help You Succeed
Presentation software can be used to present information in a classroom. Businesses use PowerPoint to deliver information to diverse audiences. PowerPoint can help me give a professional-looking presentation that is well-organized. A well designed power point PPT will help me to impress my co-workers. The purpose of presentation software allows you to display information visually so that other people will be able to understand it better. Companies can use presentation software to educate or train their employees. PowerPoint allows me to illustrate my presentations with charts and pictures. To make presentations an effective communication tool in the workplace, you should identify your audience, keep text brief and to the point, use attractive color schemes, use animation sparingly, rehearse your presentation, revise your presentation, speak clearly, and speak to your audience. Presentation skills might be useful in being a computer system analyst. They can be useful because an analyst will have to learn and teach others about that career, showing others information about computers, and to influence others down that career path. Teachers will have the greatest number of members in 2014.

Tuesday, March 6, 2012
Friday, February 10, 2012
Unit 4-Lesson 1 Introduction to Charts: Choosing the Right Graph
Graphs are used to show data visually. There are four different kinds of graphs you may use when presenting data. One is a bar graph, or a column graph. Bar graphs are used to show amounts, or a number of times a value occurs. Another graph you could use is a line graph. Line graphs plot data changes over a rate of time. The data points can show you the changes between the data. Scatter plot graphs show trends in data, and you can use this when you have a large number of data points. There a positive correlation in the data when the best fit line increases. When the best fit line decreases, there is a negative correlation. Line graphs and scatter plot graphs are almost the same, except that line graphs have connected dots and scatter plot graphs don't. You can use a pie chart to show a percent of a particular item. These are also called circle graphs. Pie charts, however, don't use a vertical or horizontal axis.
Subscribe to:
Posts (Atom)